explainerdashboard
Summary
explainerdashboard is a library for quickly building interactive dashboards
for analyzing and explaining the predictions and workings of
(scikit-learn compatible) machine learning models, including
xgboost, catboost and lightgbm. This makes your model transparant and explainable
with just two lines of code.
It allows you to investigate SHAP values, permutation importances,
interaction effects, partial dependence plots, all kinds of performance plots,
and even individual decision trees inside a random forest. With explainerdashboard any data
scientist can create an interactive explainable AI web app in minutes,
without having to know anything about web development or deployment.
You first construct an explainer object out of your model and the test data:
from explainerdashboard import ClassifierExplainer, ExplainerDashboard
explainer = ClassifierExplainer(model, X_test, y_test)
You then pass this explainer object to an ExplainerDashboard and run it:
ExplainerDashboard(explainer).run()
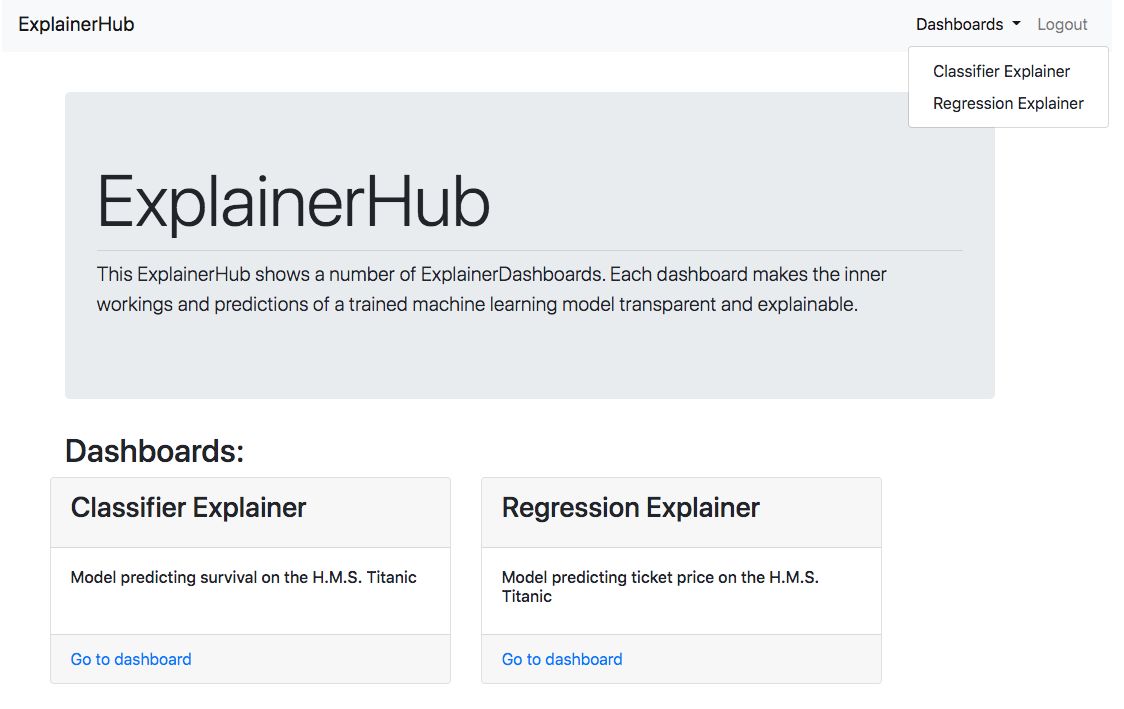
You can host multiple ExplainerDashboard in an ExplainerHub by passing in a
list of dashboards:
db1 = ExplainerDashboard(explainer1)
db2 = ExplainerDashboard(explainer2)
hub = ExplainerHub([db1, db2])
hub.run()
Each dashboard is hosted on it’s own url path (e.g. localhost:8050/dashboard1),
and a front-end dashboard with links and descriptions for every dashboard is hosted
at e.g. localhost:8050:
InlineExplainer
For viewing and customizing individual components or tabs directly inside your
notebook you use the InlineExplainer:
from explainerdashboard import InlineExplainer

InlineExplainer(explainer).shap.dependence()
InlineExplainer(explainer).shap.dependence(hide_cats=True, hide_index=True, col="Fare")
InlineExplainer(explainer).shap.overview()
InlineExplainer(explainer).tab.importances()
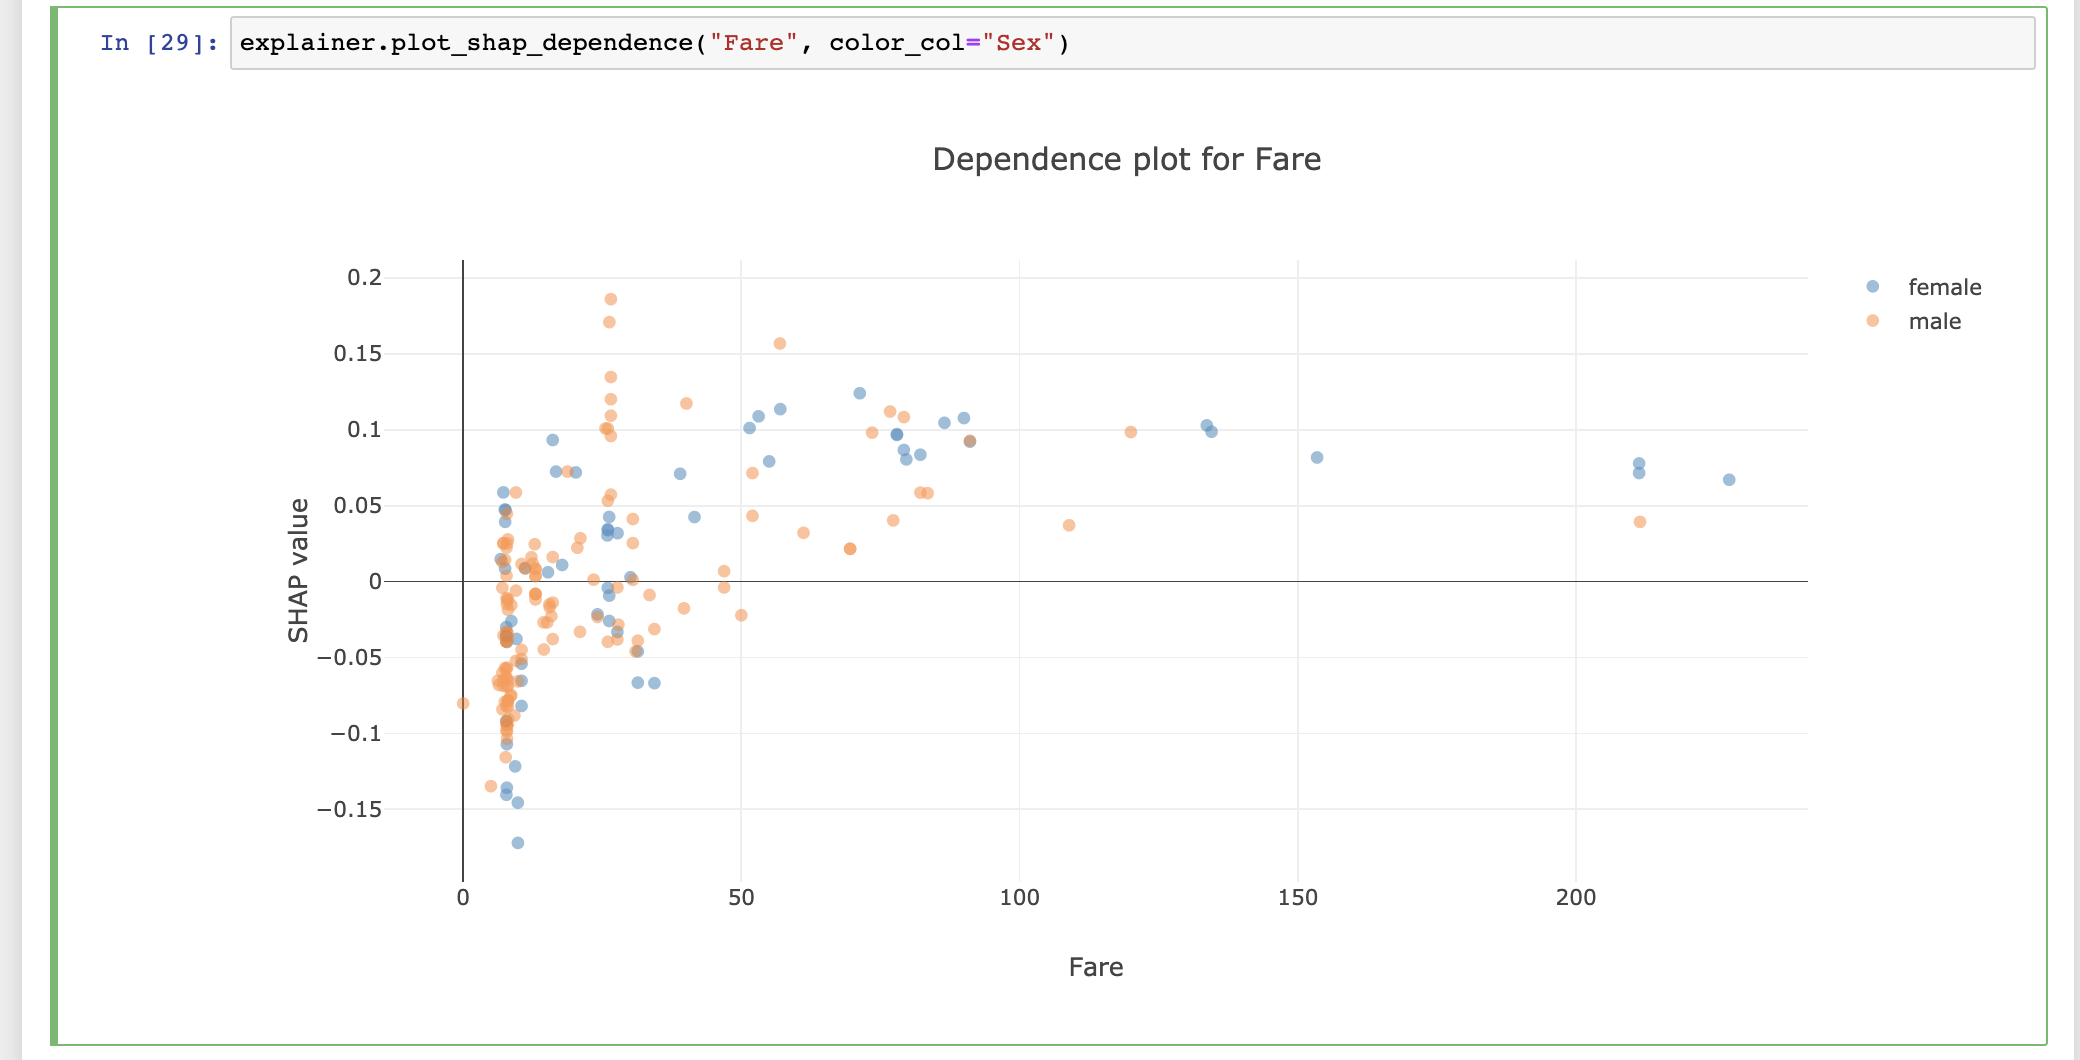
The explainer object itself is also a plot factory that you can use
to directly make plots inline in your notebook:
A more extended example
Some example code, where we load some data, fit a model, construct an explainer,
pass it on to an ExplainerDashboard and run the dashboard:
from sklearn.ensemble import RandomForestClassifier

from explainerdashboard import ClassifierExplainer, ExplainerDashboard
from explainerdashboard.datasets import titanic_survive

X_train, y_train, X_test, y_test = titanic_survive()

model = RandomForestClassifier(n_estimators=50, max_depth=5)
model.fit(X_train, y_train)

explainer = ClassifierExplainer(
                model, X_test, y_test,
                # optional:
                cats=['Sex', 'Deck', 'Embarked'],
                labels=['Not survived', 'Survived'])

db = ExplainerDashboard(explainer, title="Titanic Explainer",
                    whatif=False, # you can switch off tabs with bools
                    shap_interaction=False,
                    decision_trees=False)
db.run(port=8051)
Or, as a one-liner:
ExplainerDashboard(
    ClassifierExplainer(
        RandomForestClassifier().fit(X_train, y_train),
        X_test, y_test
    )
).run()
The result of the lines above can be seen in the screenshot above or can be viewed on this example dashboard deployed to heroku.
For a more simple single tab dashboard try:
ExplainerDashboard(explainer, simple=True).run()
Custom dashboards
You can easily remix and customize ExplainerComponent primitives into
your own custom layouts for a dashboard that is specifically tailored to
your own model and project. For example a dashboard with a single SHAP dependence
component:
from explainerdashboard.custom import *

class CustomDashboard(ExplainerComponent):
    def __init__(self, explainer, name=None):
        super().__init__(explainer, name=name)
        self.dependence = ShapDependenceComponent(explainer, name=self.name+"dep",
                hide_selector=True, hide_cats=True, hide_index=True, col="Fare")

    def layout(self):
        return html.Div([self.dependence.layout()])

ExplainerDashboard(explainer, CustomDashboard).run()
A more elaborate example of a custom dashboard (example deployed here):
More examples of how to start dashboards for different types of models and with different parameters can be found in the dashboard_examples notebook in the github repo.
For examples on how to interact with and get plots and dataframes out of the explainer object check out explainer_examples notebook in the github repo.
- Explainers
- ExplainerDashboard
- Starting the default dashboard
- Simplified single page dashboard
- Switching off tabs with booleans
- Starting a single tab dashboard
- Starting a multitab dashboard
- Using explainerdashboard inside Jupyter notebook or google colab
- Adding a theme
- Hiding title and label selector
- Choosing a port
- Exposing the flask server
- ExplainerDashboard documentation
- ExplainerHub
- InlineExplainer
- explainerdashboard CLI
- ExplainerTabs
- ImportancesComposite
- ClassifierModelStatsComposite
- RegressionModelStatsComposite
- IndividualPredictionsComposite
- WhatIfComposite
- ShapDependenceComposite
- ShapInteractionsComposite
- DecisionTreesComposite
- SimplifiedClassifierComposite
- SimplifiedRegressionComposite
- ExplainerTabsLayout
- ExplainerPageLayout
- ExplainerComponents
- Customizing your dashboard
- Building custom layout
- Deployment
- License
- Contact
- Help