Building custom layout
You can build your own custom dashboard layout by re-using the modular
ExplainerComponents and connectors without needing
to know much about web development or even much about plotly dash,
which is the underlying technology that explainerdashboard is built on.
You can get some inspiration from the explainerdashboard composites that build the layout of the default dashboard tabs. You can copy that code move some of the components around and add some text to make it specific to your own project.
Simple Example
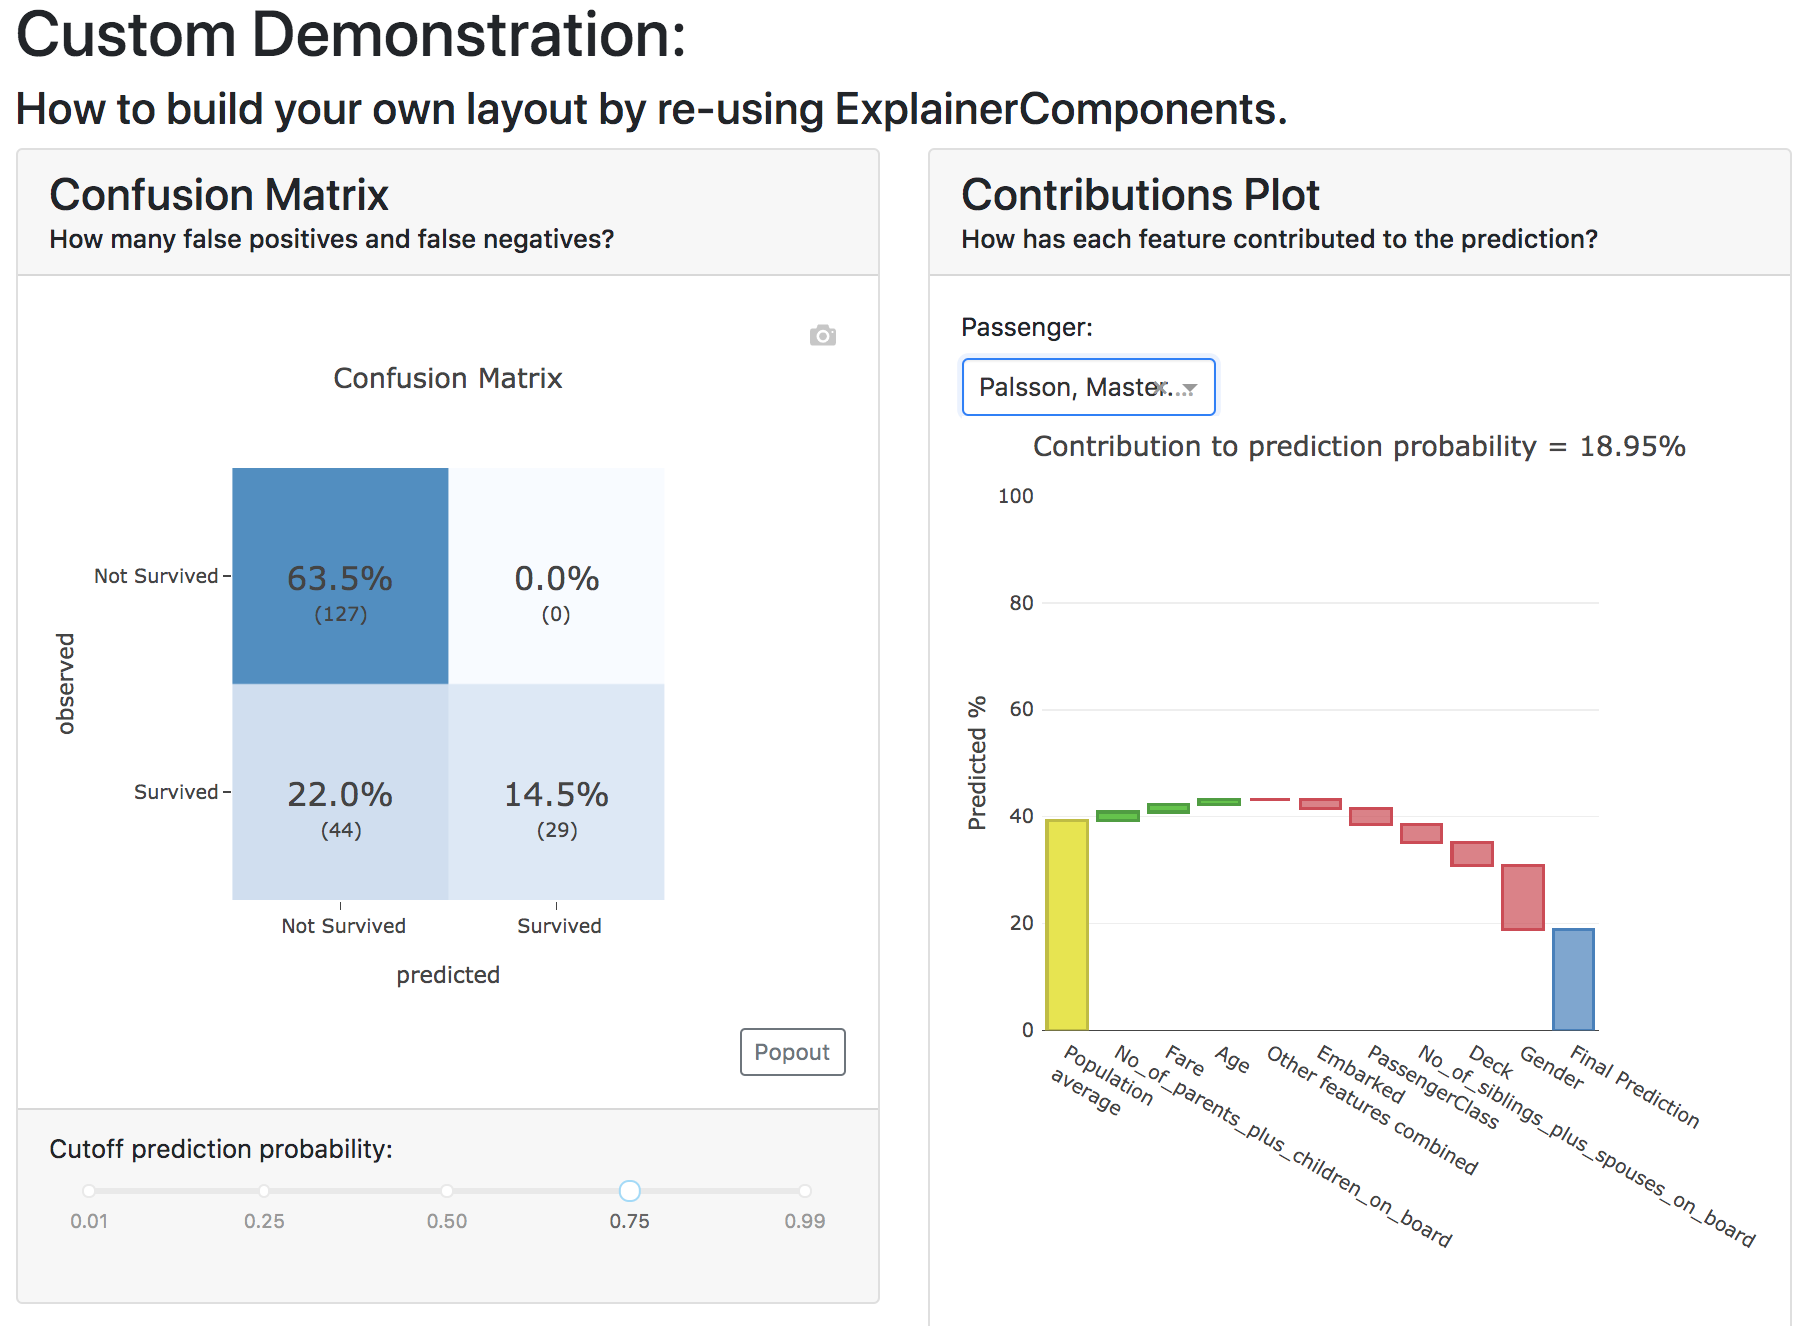
For example if you only wanted to build a custom dashboard that only contains
a ConfusionMatrixComponent and a ShapContributionsGraphComponent,
but you want to hide a few toggles:
from explainerdashboard.custom import *

class CustomDashboard(ExplainerComponent):
    def __init__(self, explainer, name=None, **kwargs):
        super().__init__(explainer, title="Custom Dashboard")
        self.confusion = ConfusionMatrixComponent(explainer,
                            hide_selector=True, hide_percentage=True,
                            cutoff=0.75, **kwargs)
        self.contrib = ShapContributionsGraphComponent(explainer,
                            hide_selector=True, hide_cats=True,
                            hide_depth=True, hide_sort=True,
                            index='Rugg, Miss. Emily', **kwargs)

    def layout(self):
        return dbc.Container([
            dbc.Row([
                dbc.Col([
                    html.H1("Custom Demonstration:"),
                    html.H3("How to build your own layout using ExplainerComponents.")
                ])
            ]),
            dbc.Row([
                dbc.Col([
                    self.confusion.layout(),
                ]),
                dbc.Col([
                    self.contrib.layout(),
                ])
            ])
        ])

db = ExplainerDashboard(explainer, CustomDashboard, hide_header=True)
db.run()
So you need to
Import
ExplainerComponentswithfrom explainerdashboard.custom import *. (this also importsdash_html_components as html,dash_core_components as dccanddash_bootstrap_components as dbcfor you.Derive a child class from
ExplainerComponent.Include
explainer, name=Nonein your__init__().Call the init of the parent class with
super().__init__(explainer, title).Instantiate the components that you wish to include as attributes in your
__init__:self.confusion = ConfusionMatrixComponent(explainer)andself.contrib = ShapContributionsGraphComponent(explainer)Define a
layout()method that returns a custom layout.Build your layout using
htmland bootstrap (dbc) elements and include your components’ layout in this overall layout withself.confusion.layout()andself.contrib.layout().Pass the class to an
ExplainerDashboardandrun()it.
You can find the list of all ExplainerComponents in the documentation.
Note
To save on boilerplate code, parameters in the __init__ will automagically be
stored to attributes by super().__init__(explainer, title). So in the example
below you do not have to explicitly call self.a = a in the init:
class CustomDashboard(ExplainerComponent):
    def __init__(self, explainer, name=None, a=1):
        super().__init__(explainer)

custom = CustomDashboard(explainer)
assert custom.a == 1
This includes the naming of the component itself, by setting name=None,
in the __init__. ExplainerDashboard will then assign a unique
name of your component to make sure that component id’s will not clash,
but will be consistent with multi worker or multi node deployments.
Including ExplainerComponents in regular dash app
An ExplainerComponent can easily be included in regular dash code:
import dash

custom = CustomDashboard(explainer)

app = dash.Dash(__name__)
app.title = "Dash demo"
app.layout = html.Div([
    custom.layout()
    ])
custom.register_callbacks(app)
app.run_server()
Constructing the layout
You construct the layout using dash_bootstrap_components and
dash_html_components:
dash_bootstrap_components
Using the dash_bootstrap_components library it is very easy to construct
a modern looking responsive web interface with just a few lines of python code.
The basis of any layout is that you divide your layout
into dbc.Rows and then divide each row into a number of dbc.Cols where the total
column widths should add up to 12. (e.g. two columns of width 6 each)
Then dash_bootstrap_components offer a lot of other modern web design
elements such as cards, modals, etc that you can find more information on in
their documentation: https://dash-bootstrap-components.opensource.faculty.ai/
dash_html_components
If you know a little bit of html then using import dash_html_components as html you
can add further elements to your design. For example in order to insert a header
add html.H1("This is my header!"), etc.
Elaborate Example
CustomModelTab
A more elaborate example is below where we include three components: the
precision graph, the shap summary and the shap dependence component, and
add explanatory text on either side of each component. The ShapSummaryDependenceConnector
connects a ShapSummaryComponent and a ShapDependenceComponent so that when you
select a feature in the summary, it automatically gets selected in the dependence
plot. You can find other connectors such IndexConnector,
PosLabelConnector, CutoffConnector
and HighlightConnector in the Connector documentation:
import dash_html_components as html
import dash_bootstrap_components as dbc

from explainerdashboard.custom import *
from explainerdashboard import ExplainerDashboard

class CustomModelTab(ExplainerComponent):
    def __init__(self, explainer, name=None):
        super().__init__(explainer, title="Titanic Explainer")
        self.precision = PrecisionComponent(explainer,
                                hide_cutoff=True, hide_binsize=True,
                                hide_binmethod=True, hide_multiclass=True,
                                hide_selector=True,
                                cutoff=None)
        self.shap_summary = ShapSummaryComponent(explainer,
                                hide_title=True, hide_selector=True,
                                hide_depth=True, depth=8,
                                hide_cats=True, cats=True)
        self.shap_dependence = ShapDependenceComponent(explainer,
                                hide_title=True, hide_selector=True,
                                hide_cats=True, cats=True,
                                hide_index=True,
                                col='Fare', color_col="PassengerClass")
        self.connector = ShapSummaryDependenceConnector(
                self.shap_summary, self.shap_dependence)

    def layout(self):
        return dbc.Container([
            html.H1("Titanic Explainer"),
            dbc.Row([
                dbc.Col([
                    html.H3("Model Performance"),
                    html.Div("As you can see on the right, the model performs quite well."),
                    html.Div("The higher the predicted probability of survival predicted by"
                            "the model on the basis of learning from examples in the training set"
                            ", the higher is the actual percentage for a person surviving in "
                            "the test set"),
                ], width=4),
                dbc.Col([
                    html.H3("Model Precision Plot"),
                    self.precision.layout()
                ])
            ]),
            dbc.Row([
                dbc.Col([
                    html.H3("Feature Importances Plot"),
                    self.shap_summary.layout()
                ]),
                dbc.Col([
                    html.H3("Feature importances"),
                    html.Div("On the left you can check out for yourself which parameters were the most important."),
                    html.Div(f"{self.explainer.columns_ranked_by_shap(cats=True)[0]} was the most important"
                            f", followed by {self.explainer.columns_ranked_by_shap(cats=True)[1]}"
                            f" and {self.explainer.columns_ranked_by_shap(cats=True)[2]}."),
                    html.Div("If you select 'detailed' you can see the impact of that variable on "
                            "each individual prediction. With 'aggregate' you see the average impact size "
                            "of that variable on the finale prediction."),
                    html.Div("With the detailed view you can clearly see that the the large impact from Sex "
                            "stems both from males having a much lower chance of survival and females a much "
                            "higher chance.")
                ], width=4)
            ]),
            dbc.Row([
                dbc.Col([
                    html.H3("Relations between features and model output"),
                    html.Div("In the plot to the right you can see that the higher the priace"
                            "of the Fare that people paid, the higher the chance of survival. "
                            "Probably the people with more expensive tickets were in higher up cabins, "
                            "and were more likely to make it to a lifeboat."),
                    html.Div("When you color the impacts by the PassengerClass, you can clearly see that "
                            "the more expensive tickets were mostly 1st class, and the cheaper tickets "
                            "mostly 3rd class."),
                    html.Div("On the right you can check out for yourself how different features impact "
                            "the model output."),
                ], width=4),
                dbc.Col([
                    html.H3("Feature impact plot"),
                    self.shap_dependence.layout()
                ]),
            ])
        ])

ExplainerDashboard(explainer, CustomModelTab, hide_header=True).run()
Note
All subcomponents that are defined as attibutes in the __init__, either
explicitly or automagically through the super().__init__, and
hence are added to self.__dict__ also automatically get their callbacks
registered when you call .register_callbacks(app) on the parent component.
If you would like to exclude that (for example because the subcomponent has
already been initialized elsewhere and you just need to store the reference),
then you can exclude it with exclude_callbacks(components):
class CustomDashboard(ExplainerComponent):
    def __init__(self, explainer, name=None, feature_input_component):
        super().__init__(explainer)
        self.exclude_callbacks(self.feature_input_component)
CustomPredictionsTab
We can also add another tab to investigate individual predictions, that
includes an index selector, a SHAP contributions graph and a Random Forest
individual trees graph. The IndexConnector connects the index selected
in ClassifierRandomIndexComponent with the index dropdown in the
contributions graph and trees components. We also pass a
custom dbc theme
called FLATLY as a custom css file:
class CustomPredictionsTab(ExplainerComponent):
    def __init__(self, explainer, name=None):
        super().__init__(explainer, title="Predictions")

        self.index = ClassifierRandomIndexComponent(explainer,
                                                    hide_title=True, hide_index=False,
                                                    hide_slider=True, hide_labels=True,
                                                    hide_pred_or_perc=True,
                                                    hide_selector=True, hide_button=False)

        self.contributions = ShapContributionsGraphComponent(explainer,
                                                            hide_title=True, hide_index=True,
                                                            hide_depth=True, hide_sort=True,
                                                            hide_orientation=True, hide_cats=True,
                                                            hide_selector=True,
                                                            sort='importance')

        self.trees = DecisionTreesComponent(explainer,
                                            hide_title=True, hide_index=True,
                                            hide_highlight=True, hide_selector=True)

        self.connector = IndexConnector(self.index, [self.contributions, self.trees])

    def layout(self):
        return dbc.Container([
            dbc.Row([
                dbc.Col([
                    html.H3("Enter name:"),
                    self.index.layout()
                ])
            ]),
            dbc.Row([
                dbc.Col([
                    html.H3("Contributions to prediction:"),
                    self.contributions.layout()
                ]),

            ]),
            dbc.Row([
                dbc.Col([
                    html.H3("Every tree in the Random Forest:"),
                    self.trees.layout()
                ]),
            ])
        ])

ExplainerDashboard(explainer, [CustomModelTab, CustomPredictionsTab],
               title='Titanic Explainer',
               header_hide_selector=True,
               bootstrap=dbc.themes.FLATLY).run()
Below you can see the result. (also note how the component title shows up as the tab title). This dashboard has also been deployed at http://titanicexplainer.herokuapp.com/custom:
Comparing multiple models
You can also compare multiple models in the same dashboard, or inside the same
tab. In this case it is important to already instantiate the component/tab before
passing it on to the ExplainerDashboard:
from explainerdashboard import *
from explainerdashboard.datasets import *
from explainerdashboard.custom import *

from sklearn.ensemble import RandomForestClassifier
from xgboost import XGBClassifier

X_train, y_train, X_test, y_test = titanic_survive()

model1 = RandomForestClassifier(n_estimators=50, max_depth=4).fit(X_train, y_train)
model2 = XGBClassifier(n_estimators=10, max_depth=5).fit(X_train, y_train)

explainer1 = ClassifierExplainer(model1, X_test, y_test)
explainer2 = ClassifierExplainer(model2, X_test, y_test)

class ConfusionComparison(ExplainerComponent):
    def __init__(self, explainer1, explainer2):
        super().__init__(explainer1)
        self.confmat1 = ConfusionMatrixComponent(explainer1, cutoff=0.6,
                            hide_selector=True, hide_percentage=True)
        self.confmat2 = ConfusionMatrixComponent(explainer2, cutoff=0.6,
                            hide_selector=True, hide_percentage=True)

    def layout(self):
        return dbc.Container([
            dbc.Row([
                dbc.Col([
                    self.confmat1.layout()
                ]),
                dbc.Col([
                    self.confmat2.layout()
                ])
            ])
        ])

tab = ConfusionComparison(explainer1, explainer2)

ExplainerDashboard(explainer1, tab).run()
Custom static html export
To enable your custom dashboard to be exported to html you need to define a to_html method
that returns an html layout. There are helper functions in explainerdashboard.to_html to
help you construct this html using python code, which get automatically loaded when
you from explainerdashboard.custom import *:
from explainerdashboard.custom import *

class CustomDashboard(ExplainerComponent):
    def __init__(self, explainer, name=None, **kwargs):
        super().__init__(explainer, title="Custom Dashboard")
        self.confusion = ConfusionMatrixComponent(explainer, **kwargs)
        self.contrib = ShapContributionsGraphComponent(explainer, **kwargs)

    def layout(self):
        return dbc.Container([
            dbc.Row([
                dbc.Col([
                    html.H1("Custom Demonstration:"),
                    html.H3("How to build your own layout using ExplainerComponents.")
                ])
            ]),
            dbc.Row([
                dbc.Col([
                    self.confusion.layout(),
                ]),
                dbc.Col([
                    self.contrib.layout(),
                ])
            ])
        ])

    def to_html(self, state_dict=None, add_header=True):
        html = to_html.title(self.title)
        html += to_html.card_row(
            self.confusion.to_html(state_dict, add_header=False),
            self.contrib.to_html(state_dict, add_header=False)
        )
        if add_header:
            return to_html.add_header(html)
        return html
So the arguments of to_html() should be (self, state_dict=None, add_header=True), and you
should pass (state_dict, add_header=False) to all sub-components. Only the top-level
component should add a html header (which links to bootstrap css and javascript and
triggers a window resize in order to fix plotly figure overflow issues).
If you build your own components whose display depend on the state of various toggles
that you put in the dash layout, you need to define input component id’s as a _state_props
class attribute. This should be a dict with the keys equal to __init__ parameters,
and the values a tuple identifying the dash component id and property. The id’s should
be without +self.name as this will get automatically added behind the scenes. (and since it’s
a class attribute it doesn’t have access to self in any case).
You can then call args = self.get_state_args(state_dict) to get the current values
of the parameters inside your to_html method. When you call the method directly
from the component (e.g. inside a jupyter notebook), it will gather the arguments
from the instance properties (so wil e.g. return {'cutoff': self.cutoff}), so it
will output html based on the initial values.
When clicking the download button on a running dashboard, it will substitute the current
values of the dashboard state. These values get collected in state_dict, which is
why it is important to pass state_dict down to subcomponents.
An example is the ConfusionMatrixComponent:
class ConfusionMatrixComponent(ExplainerComponent):
    _state_props = dict(
        cutoff=('confusionmatrix-cutoff-', 'value'),
        percentage=('confusionmatrix-percentage-', 'value'),
        normalize=('confusionmatrix-normalize-', 'value'),
        binary=('confusionmatrix-binary-', 'value'),
        pos_label=('pos-label-', 'value')
    )

    def __init__(self, explainer, title="Confusion Matrix", name=None,
                    subtitle="How many false positives and false negatives?",
                    hide_title=False, hide_subtitle=False, hide_footer=False,
                    hide_cutoff=False, hide_percentage=False, hide_binary=False,
                    hide_selector=False, hide_popout=False, hide_normalize=False,
                    normalize='all', pos_label=None, cutoff=0.5,
                    percentage=True, binary=True, description=None,
                    **kwargs):
        pass # removed the init and layout function here for brevity


    def to_html(self, state_dict=None, add_header=True):
        args = self.get_state_args(state_dict)
        fig = self.explainer.plot_confusion_matrix(cutoff=args['cutoff'],
                    percentage=bool(args['percentage']), binary=bool(args['binary']),
                    normalize=args['normalize'], pos_label=args['pos_label'])

        html = to_html.card(to_html.fig(fig), title=self.title, subtitle=self.subtitle)
        if add_header:
            return to_html.add_header(html)
        return html

    def component_callbacks(self, app):
        @app.callback(
            Output('confusionmatrix-graph-'+self.name, 'figure'),
            [Input('confusionmatrix-cutoff-'+self.name, 'value'),
            Input('confusionmatrix-percentage-'+self.name, 'value'),
            Input('confusionmatrix-normalize-'+self.name, 'value')],
            Input('confusionmatrix-binary-'+self.name, 'value'),
            Input('pos-label-'+self.name, 'value'),
        )
        def update_confusionmatrix_graph(cutoff, percentage, normalize, binary, pos_label):
            return self.explainer.plot_confusion_matrix(
                        cutoff=cutoff, percentage=bool(percentage), normalize=normalize,
                        binary=bool(binary), pos_label=pos_label)
When exporting to html you probably want to set a default index value for your
ExplainerDashboard. This is the index that will be displayed in the plots
with individual rows of data when you call
ExplainerDashboard.to_html() directly, e.g.
ExplainerDashboard(explainer, index=0).to_html('dashboard.html').
to_html helper functions
The explainerdashboard.to_html module contains a number of useful functions that you
can use inside your custom to_html() methods:
Helper module to define static html outputs
- explainerdashboard.to_html.add_header(html, title='explainerdashboard', resize=True)
Turns a html snippet into a full html layout by adding <html>, <head> and <body> tags.
Loads bootstrap css and javascript and triggers a resize event in order to prevent plotly figs from overflowing their div containers.
resize adds a javascript snippet that simulates a window resize in order to properly size the plotly figs. (bit of a hack, but it works :)
- Return type
str
- explainerdashboard.to_html.row(*cols)
Turns a series of html snippets into a bootstrap row with equally sized columns for each snippet.
- Return type
str
Example
to_html.row(“<div>first snippet</div>”, “<div>second snippet</div>”)
- explainerdashboard.to_html.rows(*col_lists)
Turns a list of lists of html snippets into a series of bootstrap rows with equally sized columns for each snippet.
- Return type
str
Example
- to_html.row(
[“<div>first snippet</div>”, “<div>second snippet</div>”], [“<div>second row snippet snippet</div>”, “<div>second row snippet two</div>”]
)
- explainerdashboard.to_html.fig(fig, include_plotlyjs='cdn', full_html=False)
Returns html for a plotly figure. By default the plotly javascript is not included but imported from the plotly cdn, and the full html wrapper is not included.
- Parameters
include_plotlyjs (bool, str) – how to import the necessary javascript for the plotly fig. Defaults to ‘cdn’, which means the figure just links to javascript file hosted by plotly. If set to True then a 3MB javascript snippet is included. For other options check https://plotly.com/python-api-reference/generated/plotly.io.to_html.html
full_html (bool) – include <html>, <head> and <body> tags. Defaults to False.
- Return type
str
- explainerdashboard.to_html.card(html, title=None, subtitle=None, border=True)
Wrap to html snippet in a bootstrap card. You can optionally add a title and subtitle to the card.
- Return type
str
- explainerdashboard.to_html.dashboard_card(title=None, description=None, url=None)
Generate a dashboard description card for ExplainerHub. Consists of title, description and url.
- Return type
str
- explainerdashboard.to_html.card_row(*cards)
Turns a series of bootstrap into a row with equally sized columns for each card.
- Return type
str
Example
to_html.card_row(‘<div class=”card”>first card</div>”, ‘<div class=”card”>second snippet</div>’)
- explainerdashboard.to_html.card_rows(*cardrows_list)
Turn a list of lists of bootstrap cards into a series of bootstrap rows with cards.
- Return type
str
Example
- to_html.card_rows(
[to_html.card(“card1”), to_html.card(“card2”)], [to_html.card(“card3”), to_html.card(“card4”)],
)
- explainerdashboard.to_html.title(title)
wrap a title string in div and <H1></H1>
- Return type
str
- explainerdashboard.to_html.div(html)
wrap an html snippet in a <div></div>
- Return type
str
- explainerdashboard.to_html.table_from_df(df)
Generate a html table from a pandas DataFrame
- Return type
str
- explainerdashboard.to_html.hide(html, hide=False)
optionally hide an html snippet (return empty div) if parameter hide=True
- Return type
str
- explainerdashboard.to_html.tabs(tabs_dict)
Generate a series of bootstrap tabs for a dictionary tabs_dict with the name of each tab as the dict key and the html contents of the tab as the dict value.
- Return type
str
- explainerdashboard.to_html.input(feature, value, disabled=False)
Return a html feature input with a feature name and default value.
- Parameters
feature (str) – name of feature
value (str) – default value
disabled (bool) – disable the input. Defaults to False.
- Return type
str
- explainerdashboard.to_html.jumbotron(title, description)
display a bootstrap jumbotron with title and description
- Return type
str