ExplainerDashboard
Starting the default dashboard
In order to start an ExplainerDashboard you first need to contruct an Explainer instance.
On the basis of this explainer you can then quickly start an interactive dashboard.
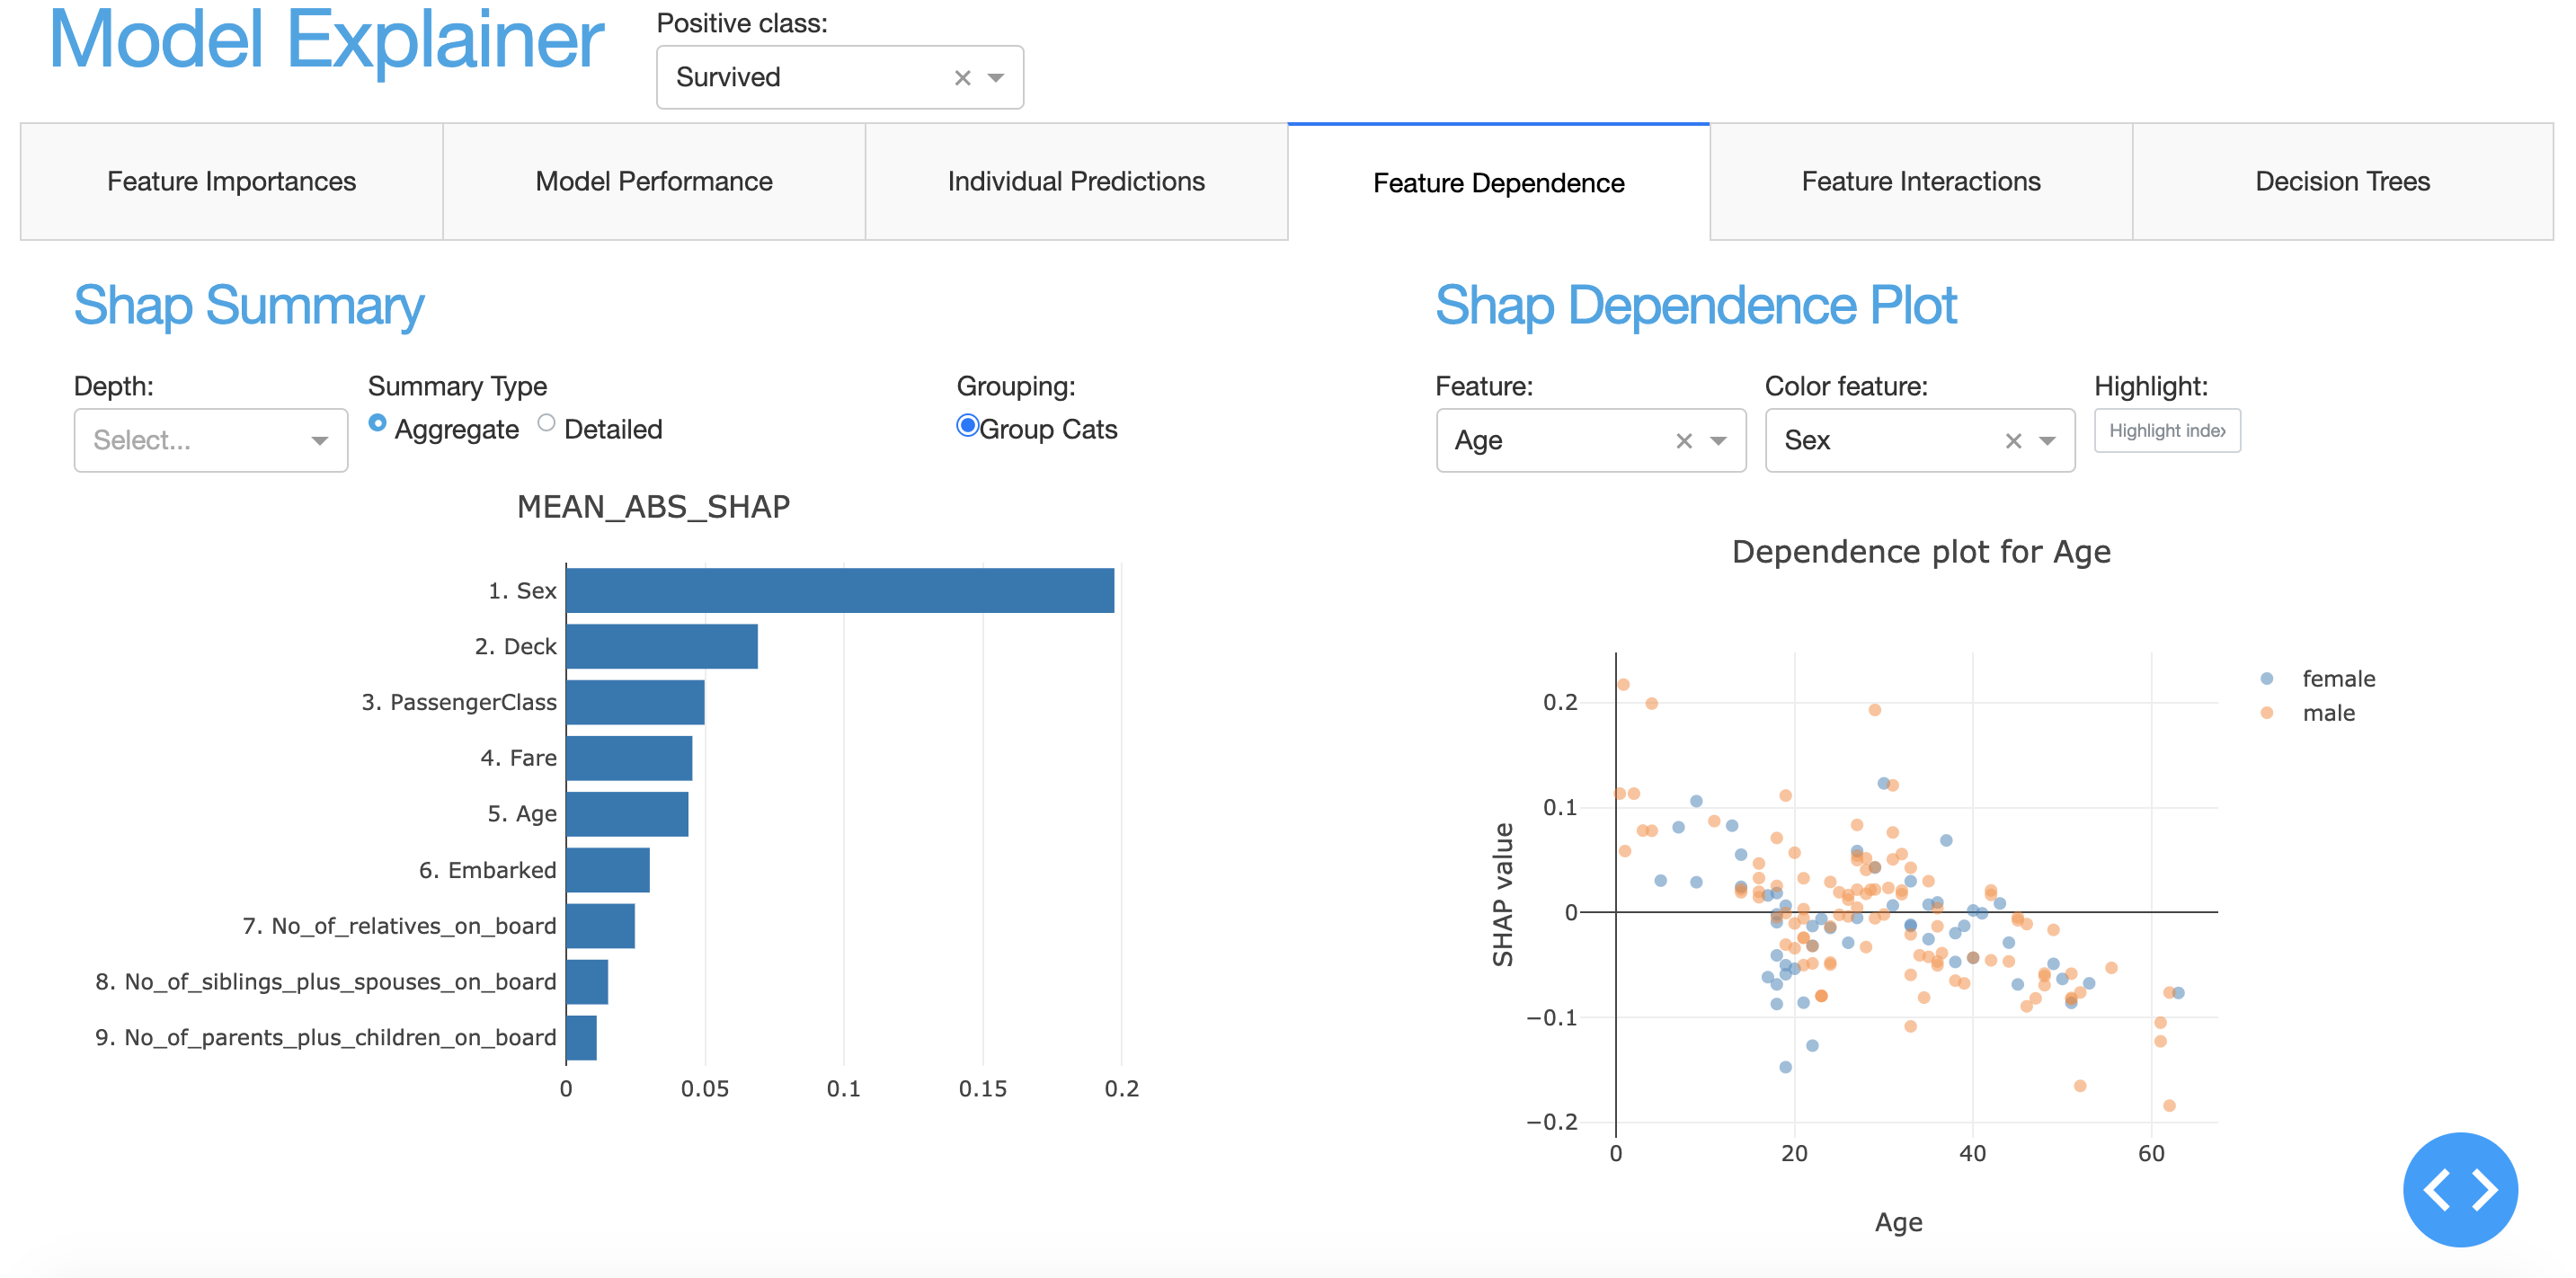
The ExplainerDashboard API is quite flexible. By default it tries to display
all the default tabs that are compatible with your model and model_output
(i.e. interactions and decision_trees might be excluded):
from explainerdashboard import ClassifierExplainer, ExplainerDashboard

explainer = ClassifierExplainer(model, X_test, y_test)
ExplainerDashboard(explainer).run()
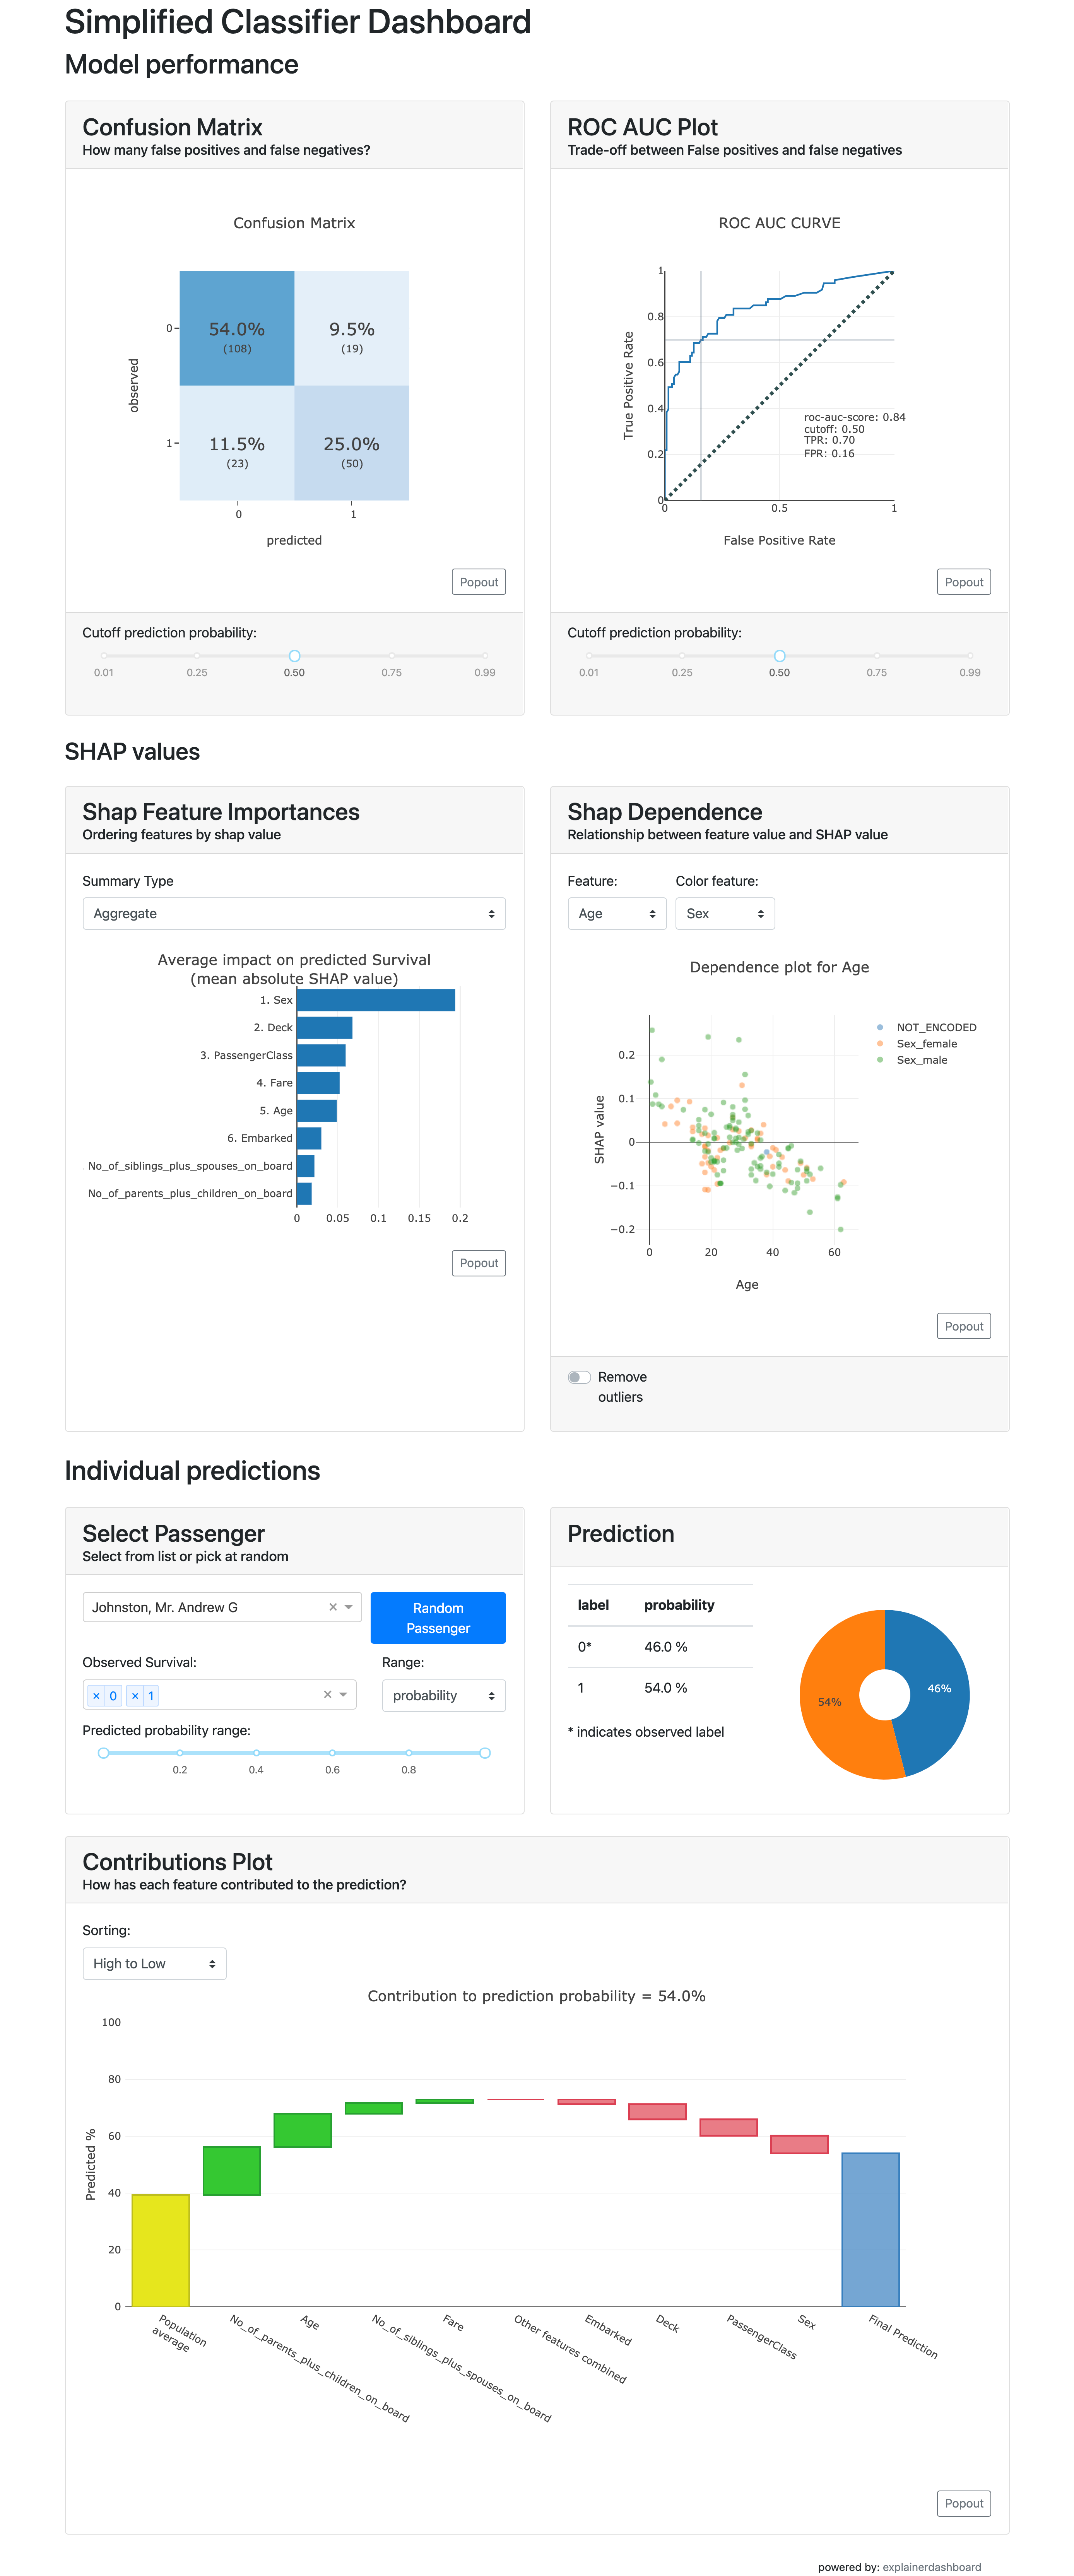
Simplified single page dashboard
For a simplified single page dashboard, use:
ExplainerDashboard(explainer, simple=True).run()
screenshot
Switching off tabs with booleans
If you’d like a little bit more control over which tabs are displayed, you can switch off individual tabs with their respective booleans (they all default to True):
ExplainerDashboard(explainer,
   importances=True,
   model_summary=False,
   contributions=True,
   whatif=True,
   shap_dependence=True,
   shap_interaction=False
   decision_trees=True
).run()
Note
The interactions tab can take quite some time to compute, so you would usually switch it off if you’re not particularly interested in interaction effects between features.
Starting a single tab dashboard
If you pass a single ExplainerComponent class or instance or string identifier, ExplainerDashboard will display that component as a standalone page. The following three lines will all have the effect of launching an ImportancesTab as a single page:
from explainerdashboard.custom import ImportancesComposite

ExplainerDashboard(explainer, ImportancesComposite).run()

imp_tab = ImportancesTab(explainer)
ExplainerDashboard(explainer, imp_tab).run()

ExplainerDashboard(explainer, "importances").run()
Starting a multitab dashboard
Besided the single page dashboard above you can also pass a list of
ExplainerComponents to construct multiple tabs. These can be a mix of
the different types discussed above. E.g.:
ExplainerDashboard(explainer, [ImportancesCompoiste, imp_tab, "importances"]).run()
This would start a dashboard with three importances tabs. (not sure why you would do that, but hopefully you get the point :)
The tabs can be imported from explainerdashboard.custom, they include
ImportancesComposite, ModelSummaryComposite, IndividualPredictionsComposite,
WhatIfComposite, ShapDependenceComposite, ShapInteractionsComposite
and DecisionTreesComposite.
You can also build your own custom tabs, see the Custom Dashboards section.
Using explainerdashboard inside Jupyter notebook or google colab
You can start the dashboard with the standard dash.Dash() server or with the
new notebook friendly JupyterDash server. The latter will allow you
to keep working interactively in your notebook while the dashboard is running.
Also, this allows you to run an explainerdashboard from within Google Colab!
The default dash server is started with mode='dash'. (except in Google
Colab, where the default is mode='external') There are three notebook compatible
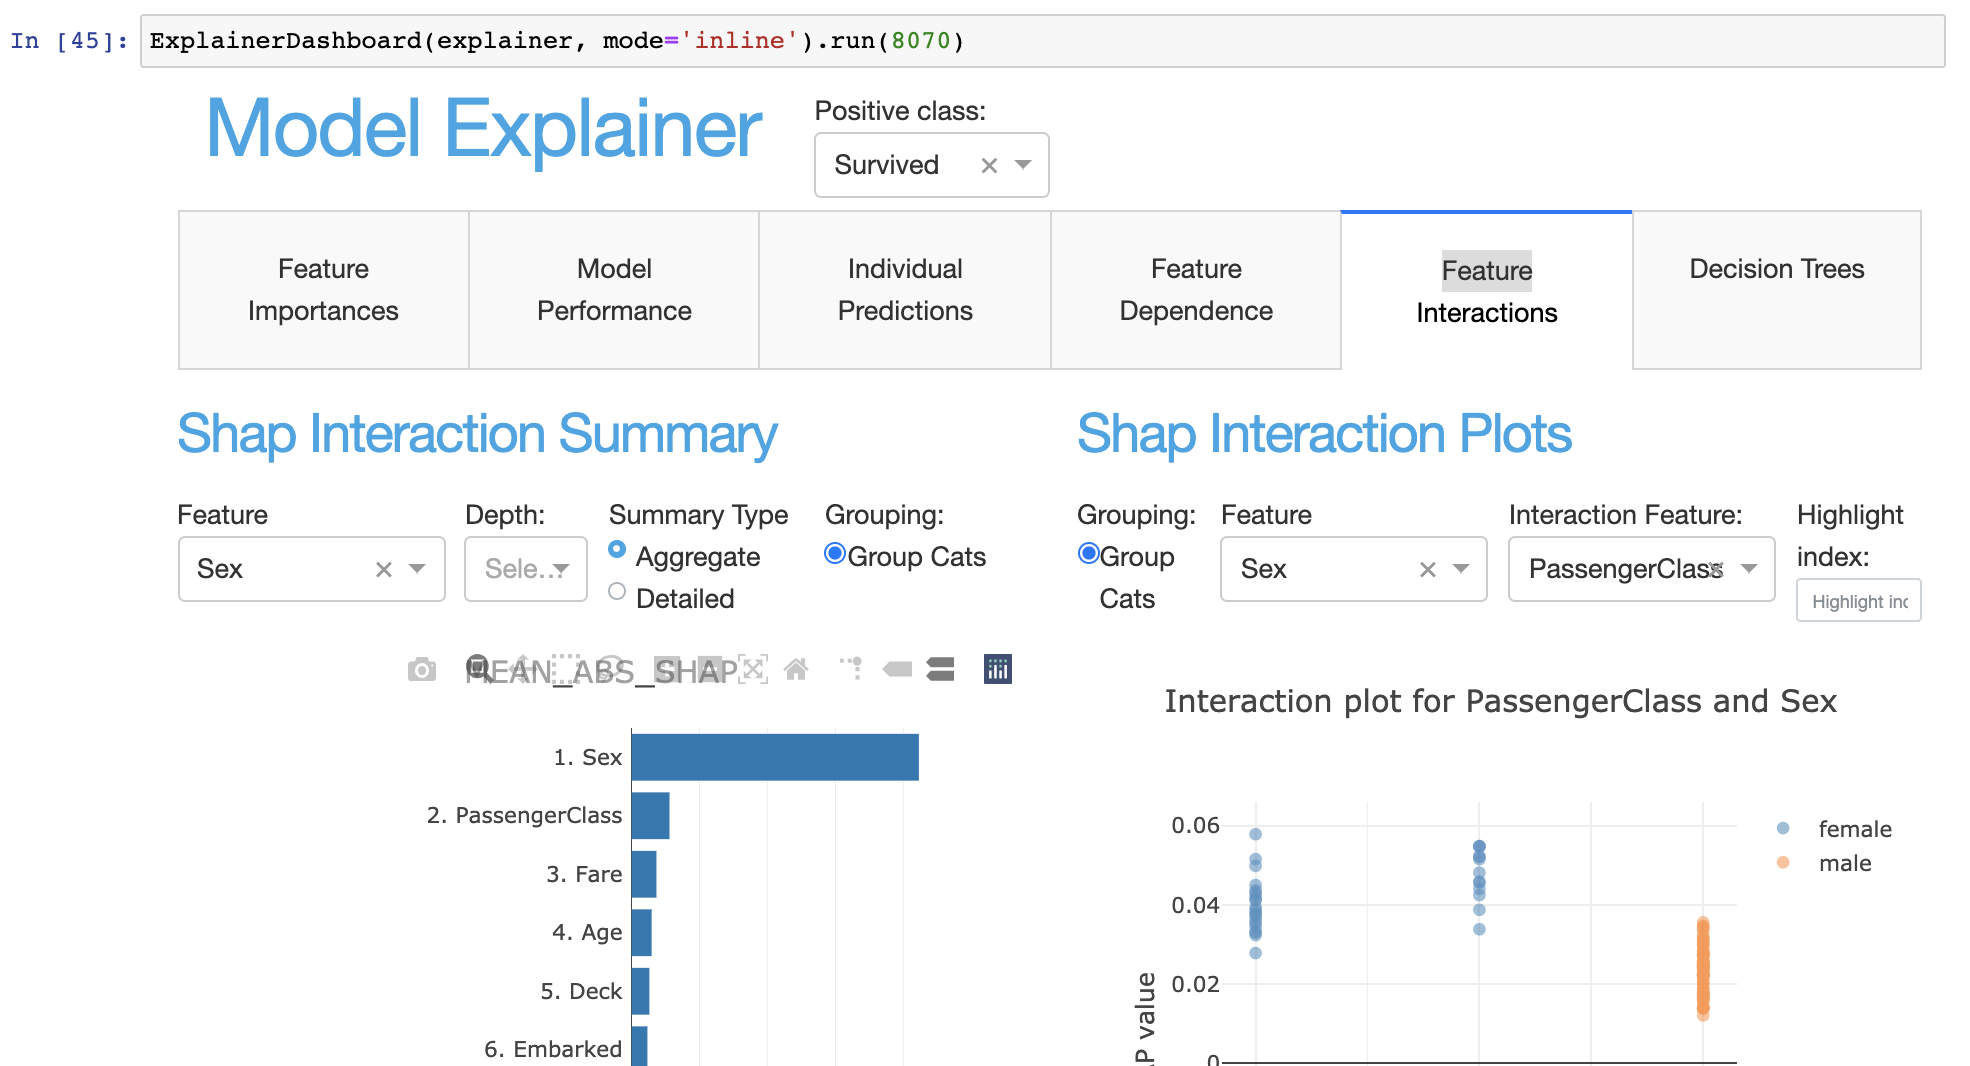
options: mode='inline' for running the dashboard in an
output cell in your notebook, mode='jupyterlab' for runnning the dashboard in
jupyterlab pane, or mode='external' which runs the dashboard in a seperate tab:
ExplainerDashboard(explainer).run() # default is either 'dash' or 'external' in colab
ExplainerDashboard(explainer, mode='dash').run()
ExplainerDashboard(explainer, mode='inline').run(port=8051)
ExplainerDashboard(explainer, mode='jupyterlab').run(8052)
ExplainerDashboard(explainer, mode='external').run()
The parameters width and height determine the size of the output area in pixels.
(default to 1000x800). You can kill a JupyterDash based dashboard with the
classmethod .terminate(port):
ExplainerDashboard().terminate(8050)
Adding a theme
explainerdashboard comes with the default bootstrap theme, but you can override
it with the bootstrap parameter. Additional info on styling bootstrap
layout can be found at: https://dash-bootstrap-components.opensource.faculty.ai/docs/themes/
You can add a theme passing a url of the .css stylesheet. dash_bootstrap_components provide
a convenient themes module with urls to the most popular themes, e.g.:
from dash_bootstrap_components.themes import FLATLY

ExplainerDashboard(explainer, ["contributions", "model_summary"],
                bootstrap=FLATLY, mode='external').run()
Example of a nice flat black and white theme called “FLATLY”:
The full list of available themes can be found on the dbc documentation page.
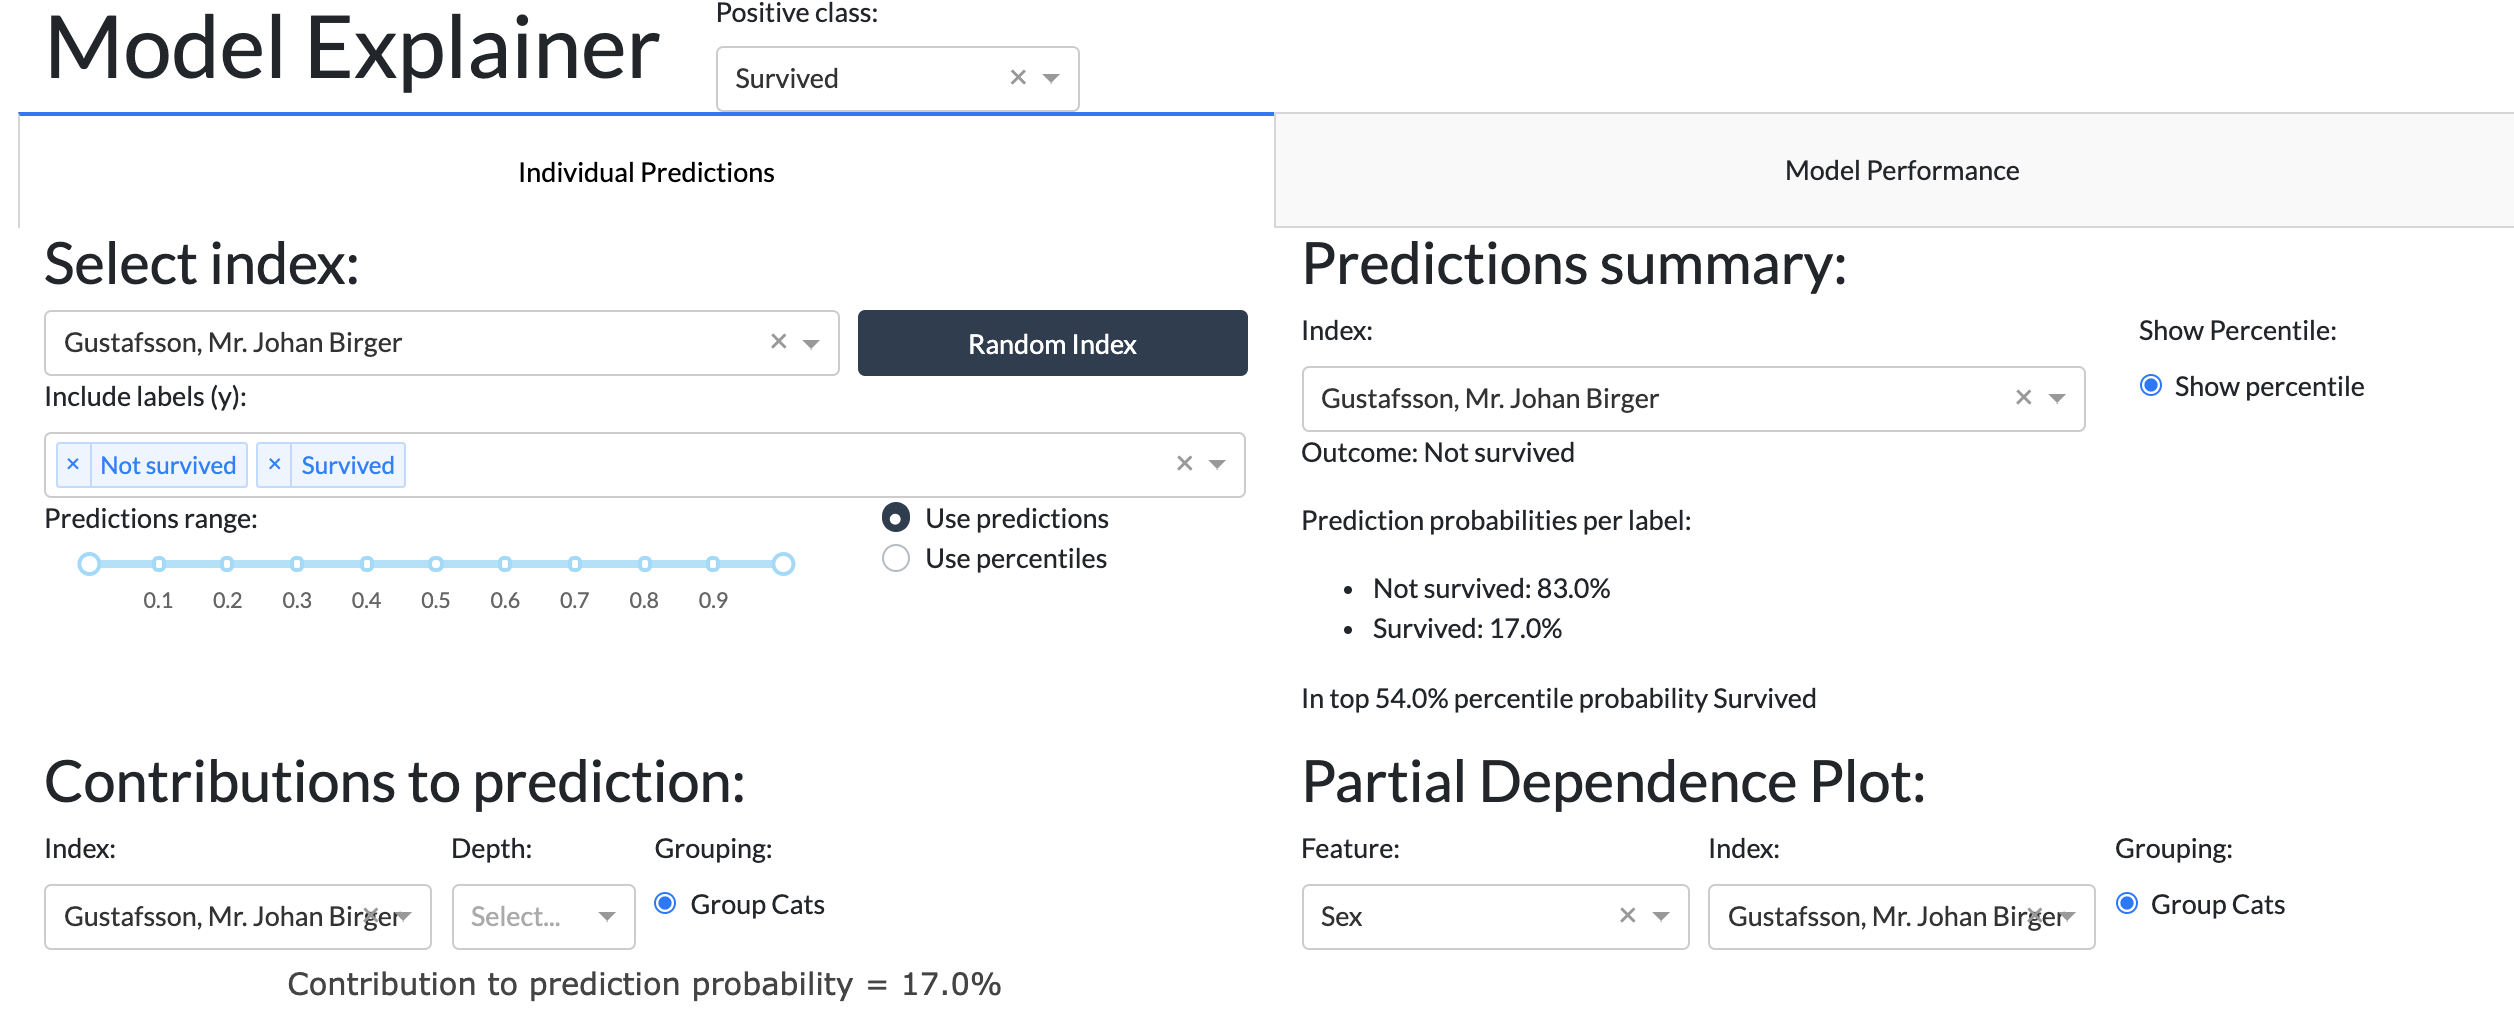
Hiding title and label selector
For multiclass classification models it is convenient to be able to set the
positive class for the entire dashboard with the dropdown in the header.
However if you wish to this dropdown selector you can simply pass header_hide_selector=True.
In order to hide the title itself pass header_hide_title=True. Or to hide
the entire header pass hide_header=True.
Choosing a port
By default dash apps run on port 8050, however you can choose any other port
in the run method:
ExplainerDashboard(explainer).run(port=8051)
Or even shorter:
ExplainerDashboard(explainer).run(8051)
Exposing the flask server
When running a dashboard in production you probably want to run it with some
heavier web server like gunicorn or waitress. For this you need to expose the flask
server. This can be found in self.app.server, or with the flask_server() method.
If you define your dashboard in dashboard.py then you can expose your dashboard server like this:
db = ExplainerDashboard(explainer)
server = db.flask_server()
# equivalently: server = db.app.server
You then start the dashboard on the commandline with:
gunicorn dashboard:server
Or if you are on windows:
waitress-serve dashboard:server
See the deployment section for more info on using explainerdashboard in production.
ExplainerDashboard documentation
- class explainerdashboard.dashboards.ExplainerDashboard(explainer=None, tabs=None, title='Model Explainer', name=None, description=None, simple=False, hide_header=False, header_hide_title=False, header_hide_selector=False, header_hide_download=False, hide_poweredby=False, block_selector_callbacks=False, pos_label=None, fluid=True, mode='dash', width=1000, height=800, bootstrap=None, external_stylesheets=None, server=True, url_base_pathname=None, routes_pathname_prefix=None, requests_pathname_prefix=None, responsive=True, logins=None, port=8050, importances=True, model_summary=True, contributions=True, whatif=True, shap_dependence=True, shap_interaction=True, decision_trees=True, **kwargs)
Creates an explainerdashboard out of an Explainer object.
- single page dashboard:
If tabs is a single ExplainerComponent class or instance, display it as a standalone page without tabs.
- Multi tab dashboard:
If tabs is a list of ExplainerComponent classes or instances, then construct a layout with a tab per component. Instead of components you can also pass the following strings: “importances”, “model_summary”, “contributions”, “shap_dependence”, “shap_interaction” or “decision_trees”. You can mix and combine these different modularities, e.g.:
tabs=[ImportancesTab, “contributions”, custom_tab]
- If tabs is None, then construct tabs based on the boolean parameters:
importances, model_summary, contributions, shap_dependence, shap_interaction and decision_trees, which all default to True.
- You can select four different modes:
‘dash’: standard dash.Dash() app
‘inline’: JupyterDash app inline in a notebook cell output
‘jupyterlab’: JupyterDash app in jupyterlab pane
‘external’: JupyterDash app in external tab
- You can switch off the title and positive label selector
with header_hide_title=True and header_hide_selector=True.
- You run the dashboard
with e.g. ExplainerDashboard(explainer).run(port=8050)
- Parameters
explainer() – explainer object
tabs() – single component or list of components
title (str, optional) – title of dashboard, defaults to ‘Model Explainer’
name (str, optional) – name of the dashboard. Used for assigning url in ExplainerHub.
description (str, optional) – summary for dashboard. Gets used for title tooltip and in description for ExplainerHub.
simple (bool, optional) – instead of full dashboard with all tabs display a single page SimplifiedClassifierDashboard or SimplifiedRegressionDashboard.
hide_header (bool, optional) hide the header (title+selector) –
header_hide_title (bool, optional) – hide the title, defaults to False
header_hide_selector (bool, optional) – hide the positive class selector for classifier models, defaults, to False
header_hide_download (bool, optional) – hide the download link in the header. Defaults to False.
hide_poweredby (bool, optional) – hide the powered by footer
block_selector_callbacks (bool, optional) – block the callback of the pos label selector. Useful to avoid clashes when you have your own PosLabelSelector in your layout. Defaults to False.
pos_label ({int, str}, optional) – initial pos label. Defaults to explainer.pos_label
mode (str, {'dash', 'inline' , 'jupyterlab', 'external'}, optional) – type of dash server to start. ‘inline’ runs in a jupyter notebook output cell. ‘jupyterlab’ runs in a jupyterlab pane. ‘external’ runs in an external tab while keeping the notebook interactive.
fluid (bool, optional) – whether to stretch the layout to available space. Defaults to True.
width (int, optional) – width of notebook output cell in pixels, defaults to 1000.
height (int, optional) – height of notebookn output cell in pixels, defaults to 800.
bootstrap (str, optional) – link to bootstrap url. Can use dbc.themese to generate the url, e.g. bootstrap=dbc.themes.FLATLY. Defaults to default bootstrap theme that is stored in the /assets folder so that it works even behind a firewall.
external_stylesheets (list, optional) – additional external stylesheets to add. (for themes use the bootstrap parameter)
server (Flask instance or bool) – either an instance of an existing Flask server to tie the dashboard to, or True in which case a new Flask server is created.
url_base_pathname (str) – url_base_pathname for dashboard, e.g. “/dashboard”. Defaults to None.
responsive (bool) – make layout responsive to viewport size (i.e. reorganize bootstrap columns on small devices). Set to False when e.g. testing with a headless browser. Defaults to True.
logins (list of lists) – list of (hardcoded) logins, e.g. [[‘login1’, ‘password1’], [‘login2’, ‘password2’]]. Defaults to None (no login required)
importances (bool, optional) – include ImportancesTab, defaults to True.
model_summary (bool, optional) – include ModelSummaryTab, defaults to True.
contributions (bool, optional) – include ContributionsTab, defaults to True.
whatif (bool, optional) – include WhatIfTab, defaults to True.
shap_dependence (bool, optional) – include ShapDependenceTab, defaults to True.
shap_interaction (bool, optional) – include InteractionsTab if model allows it, defaults to True.
decision_trees (bool, optional) – include DecisionTreesTab if model allows it, defaults to True.
- flask_server()
returns self.app.server so that it can be exposed to e.g. gunicorn
- run(port=None, host='0.0.0.0', use_waitress=False, mode=None, **kwargs)
Start ExplainerDashboard on port
- Parameters
port (int, optional) – port to run on. If None, then use self.port.
host (str, optional) – host to run on. Defaults to ‘0.0.0.0’.
use_waitress (bool, optional) – use the waitress python web server instead of the flask development server. Only works with mode=’dash’. Defaults to False.
mode (str, {'dash', 'inline' , 'jupyterlab', 'external'}, optional) – Type of dash server to start. ‘inline’ runs in a jupyter notebook output cell. ‘jupyterlab’ runs in a jupyterlab pane. ‘external’ runs in an external tab while keeping the notebook interactive. ‘dash’ is the default server. Overrides self.mode, in which case the dashboard will get rebuilt before running it with the right type of dash server. (dash.Dash or JupyterDash). Defaults to None (i.e. self.mode)
8050. (Defaults to None.self.port defaults to) –
- Raises
ValueError – if mode is unknown
- classmethod terminate(port, token=None)
Classmethodd to terminate any JupyterDash dashboard (so started with mode=’inline’, mode=’external’ or mode=’jupyterlab’) from any ExplainerDashboard by specifying the right port.
Example
ExplainerDashboard(explainer, mode=’external’).run(port=8050)
ExplainerDashboard.terminate(8050)
- Parameters
port (int) – port on which the dashboard is running.
token (str, optional) – JupyterDash._token class property. Defaults to the _token of the JupyterDash in the current namespace.
- Raises
ValueError – if can’t find the port to terminate.